What is Time Series

Any data recorded with some fixed interval of time is called as time series data. This fixed interval can be hourly, daily, monthly or yearly. e.g. hourly temperature reading, daily changing fuel prices, monthly electricity bill, annul company profit report etc. In time series data, time will always be independent variable and there can be one or many dependent variable.
Sales forecasting time series with shampoo sales for every month will look like this,
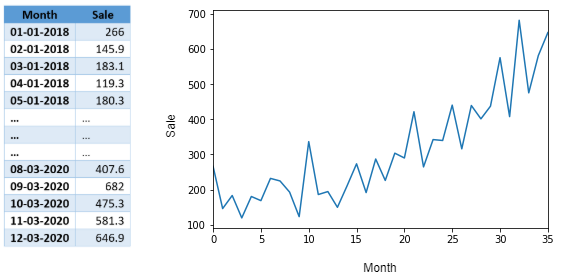
In above example since there is only one variable dependent on time so its called as univariate time series. If there are multiple dependent variables, then its called as multivariate time series.
Objective of time series analysis is to understand how change in time affect the dependent variables and accordingly predict values for future time intervals.
[ad]
Time Series Characteristics
Mean, standard deviation and seasonality defines different characteristics of the time series.
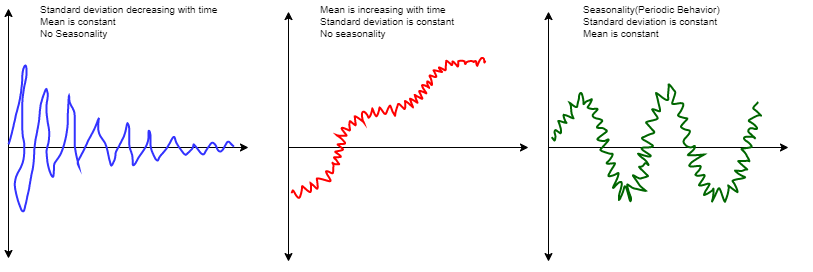
Important characteristics of the time series are as below
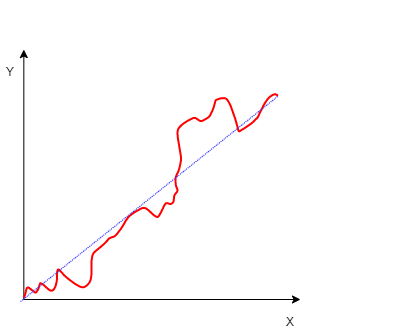
Trend
Trend represent the change in dependent variables with respect to time from start to end. In case of increasing trend dependent variable will increase with time and vice versa. It’s not necessary to have definite trend in time series, we can have a single time series with increasing and decreasing trend. In short trend represent the varying mean of time series data.
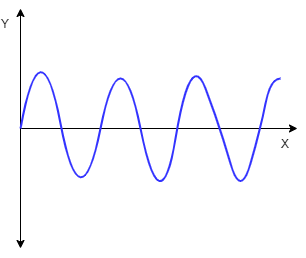
Seasonality
If observations repeats after fixed time interval then they are referred as seasonal observations. These seasonal changes in data can occur because of natural events or man-made events. For example every year warm cloths sales increases just before winter season. So seasonality represent the data variations at fixed intervals.
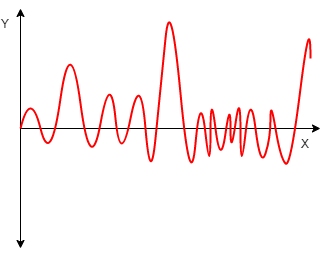
Irregularities
This is also called as noise. Strange dips and jump in the data are called as irregularities. These fluctuations are caused by uncontrollable events like earthquakes, wars, flood, pandemic etc. For example because of COVID-19 pandemic there is huge demand for hand sanitizers and masks.
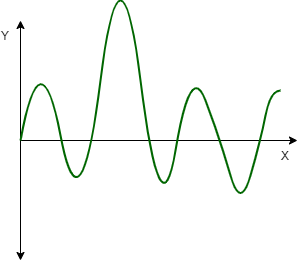
Cyclicity
Cyclicity occurs when observations in the series repeats in random pattern. Note that if there is any fixed pattern then it becomes seasonality, in case of cyclicity observations may repeat after a week, months or may be after a year. These kinds of patterns are much harder to predict.
Time series data which has above characteristics is called as ‘Non-Stationary Data’. For any analysis on time series data we must convert it to ‘Stationary Data’
The general guideline is to estimate the trend and seasonality in the time series, and then make the time series stationary for data modeling. In data modeling step statistical techniques are used for time series analysis and forecasting. Once we have the predictions, in the final step forecasted values converted into the original scale by applying trend and seasonality constraints back.
[ad]
Part 2 of this Time Series Analysis series will introduce you to doing time series analysis. The link to part 2 is here